Blockchain Gravityresearch
/ 31 — Try for free Pricing
Blockchain Gravity research

We record high-resolution crypto market data in real time on our own servers.

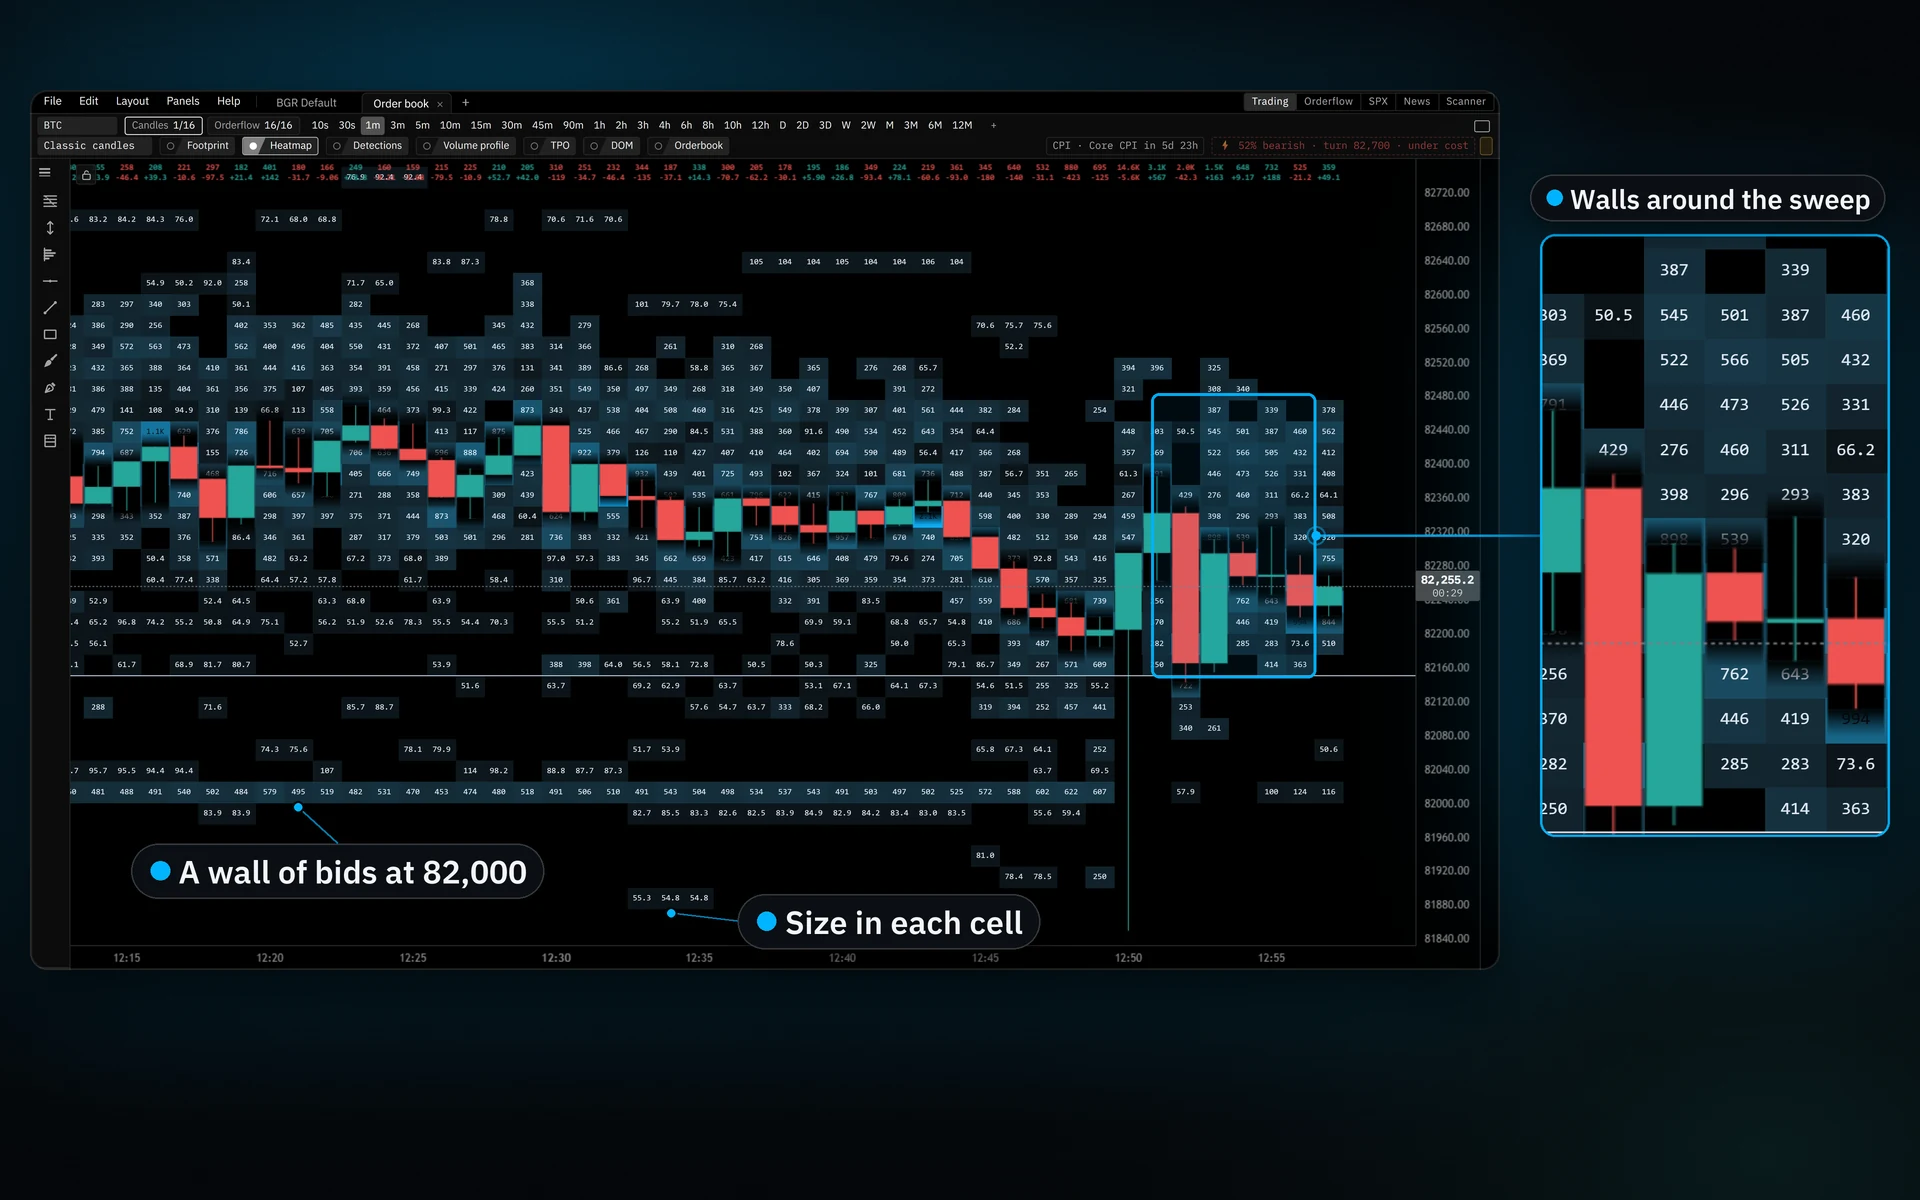
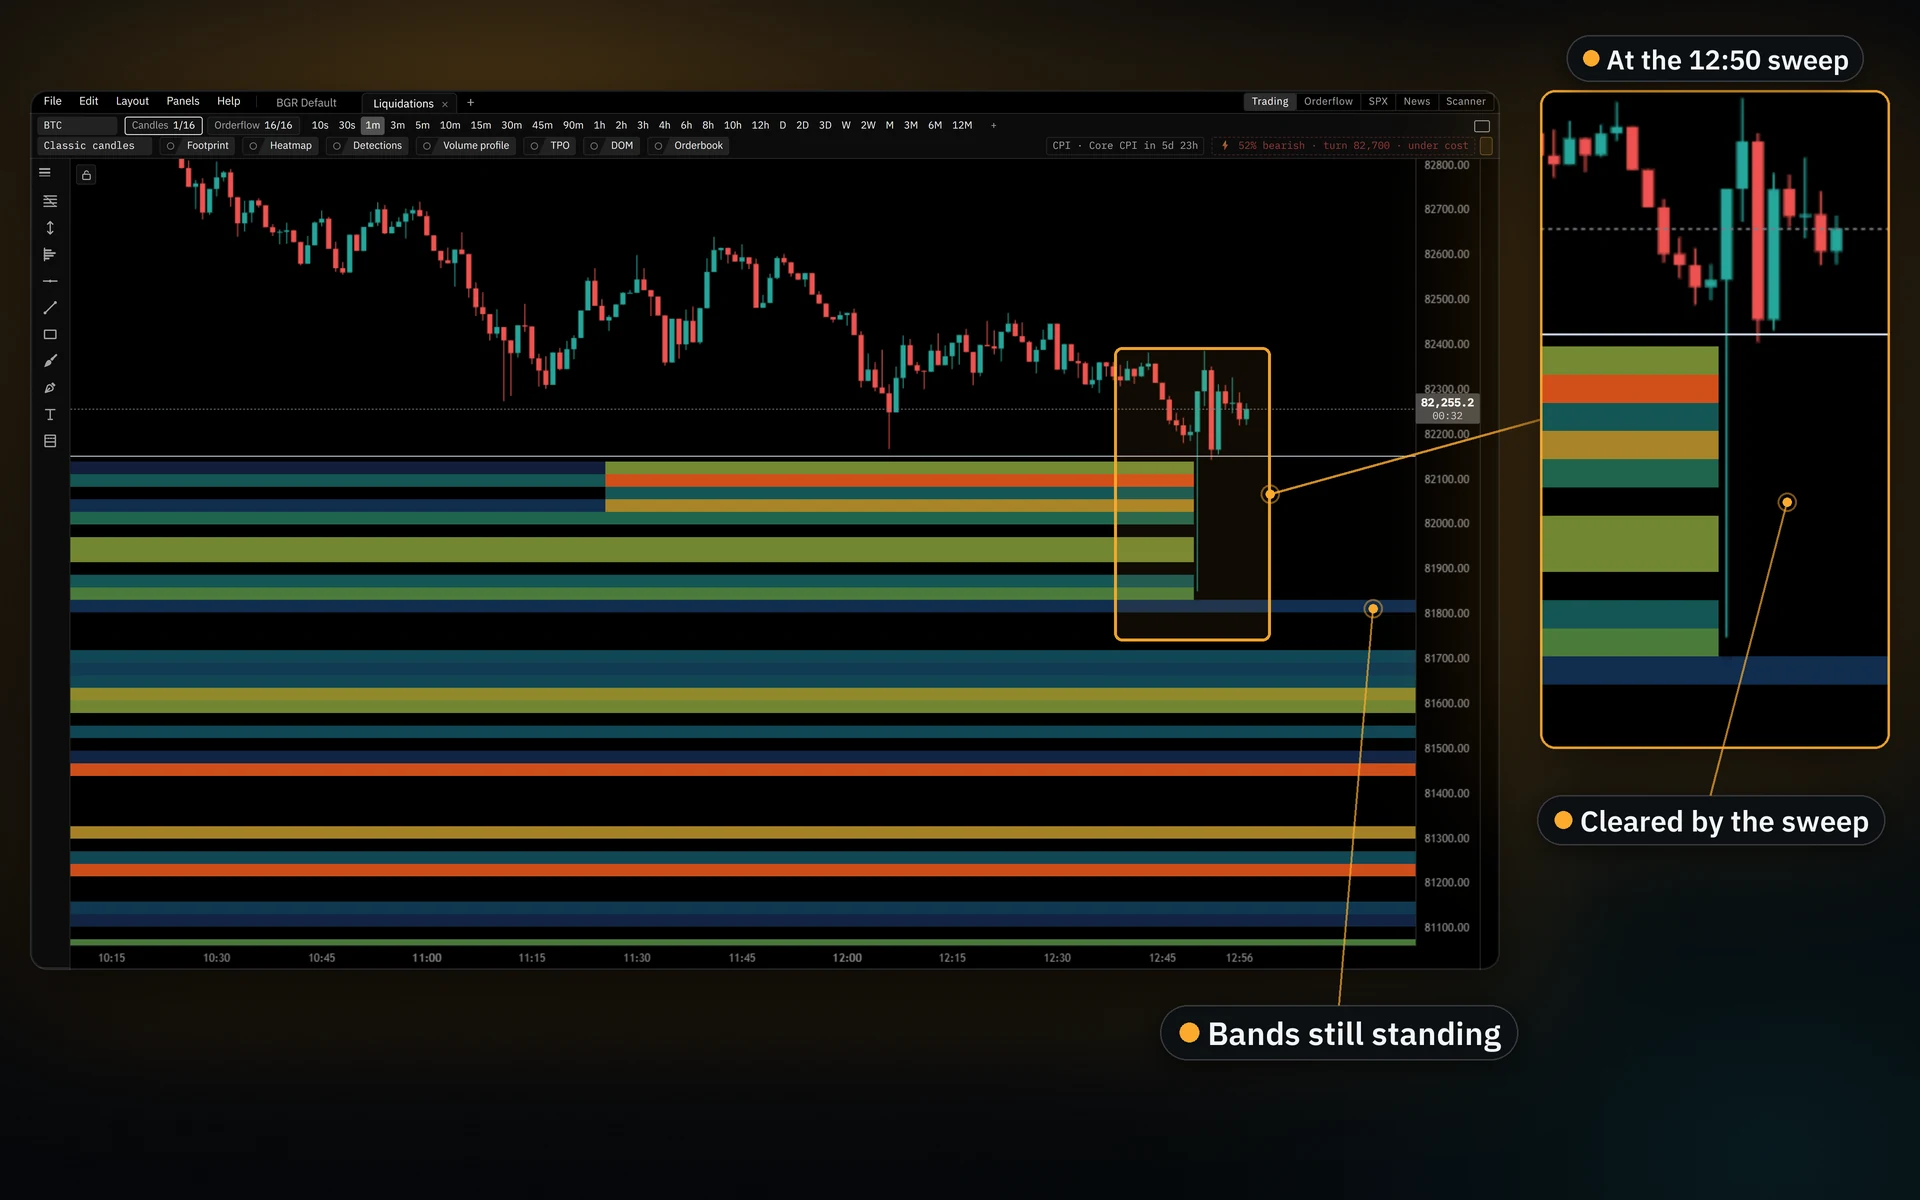
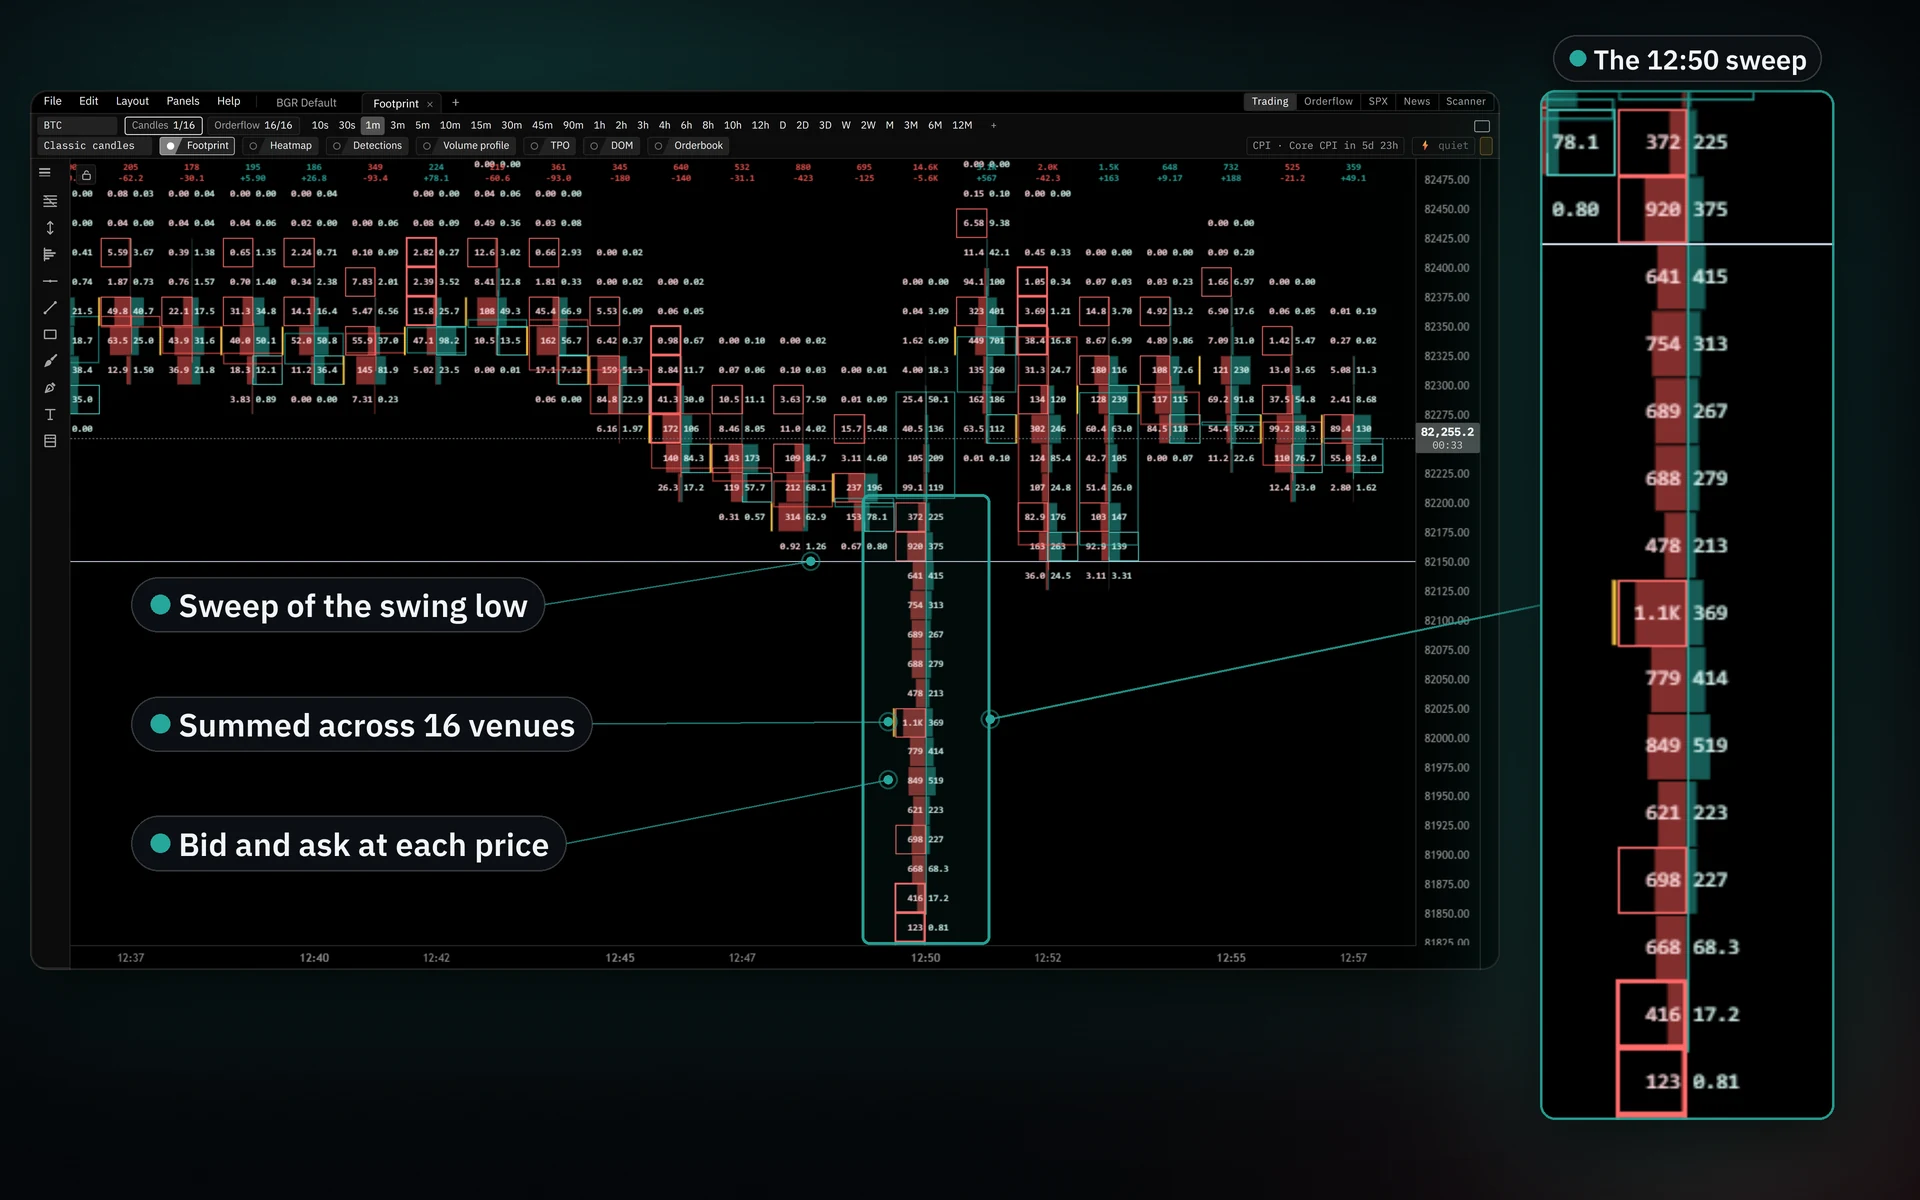
The Terminal builds a footprint chart from 15+ venues and draws live heatmaps of the order book and liquidations. Its trading panel places orders through your exchange's API and has custom order tools. A Claude assistant on our servers reads live market data and our own research, and it compares today's market with years of recorded structure and orderflow.

  • We record it ourselvesOur servers capture trades, order books, liquidations and open interest around the clock.
  • Every figure shows its ageStale data is flagged. Missing data shows a dash instead of a zero.
  • Free in the browserThe orderflow, heatmaps, news and contract scanner pages are free, and the news page has a live sentiment rating.
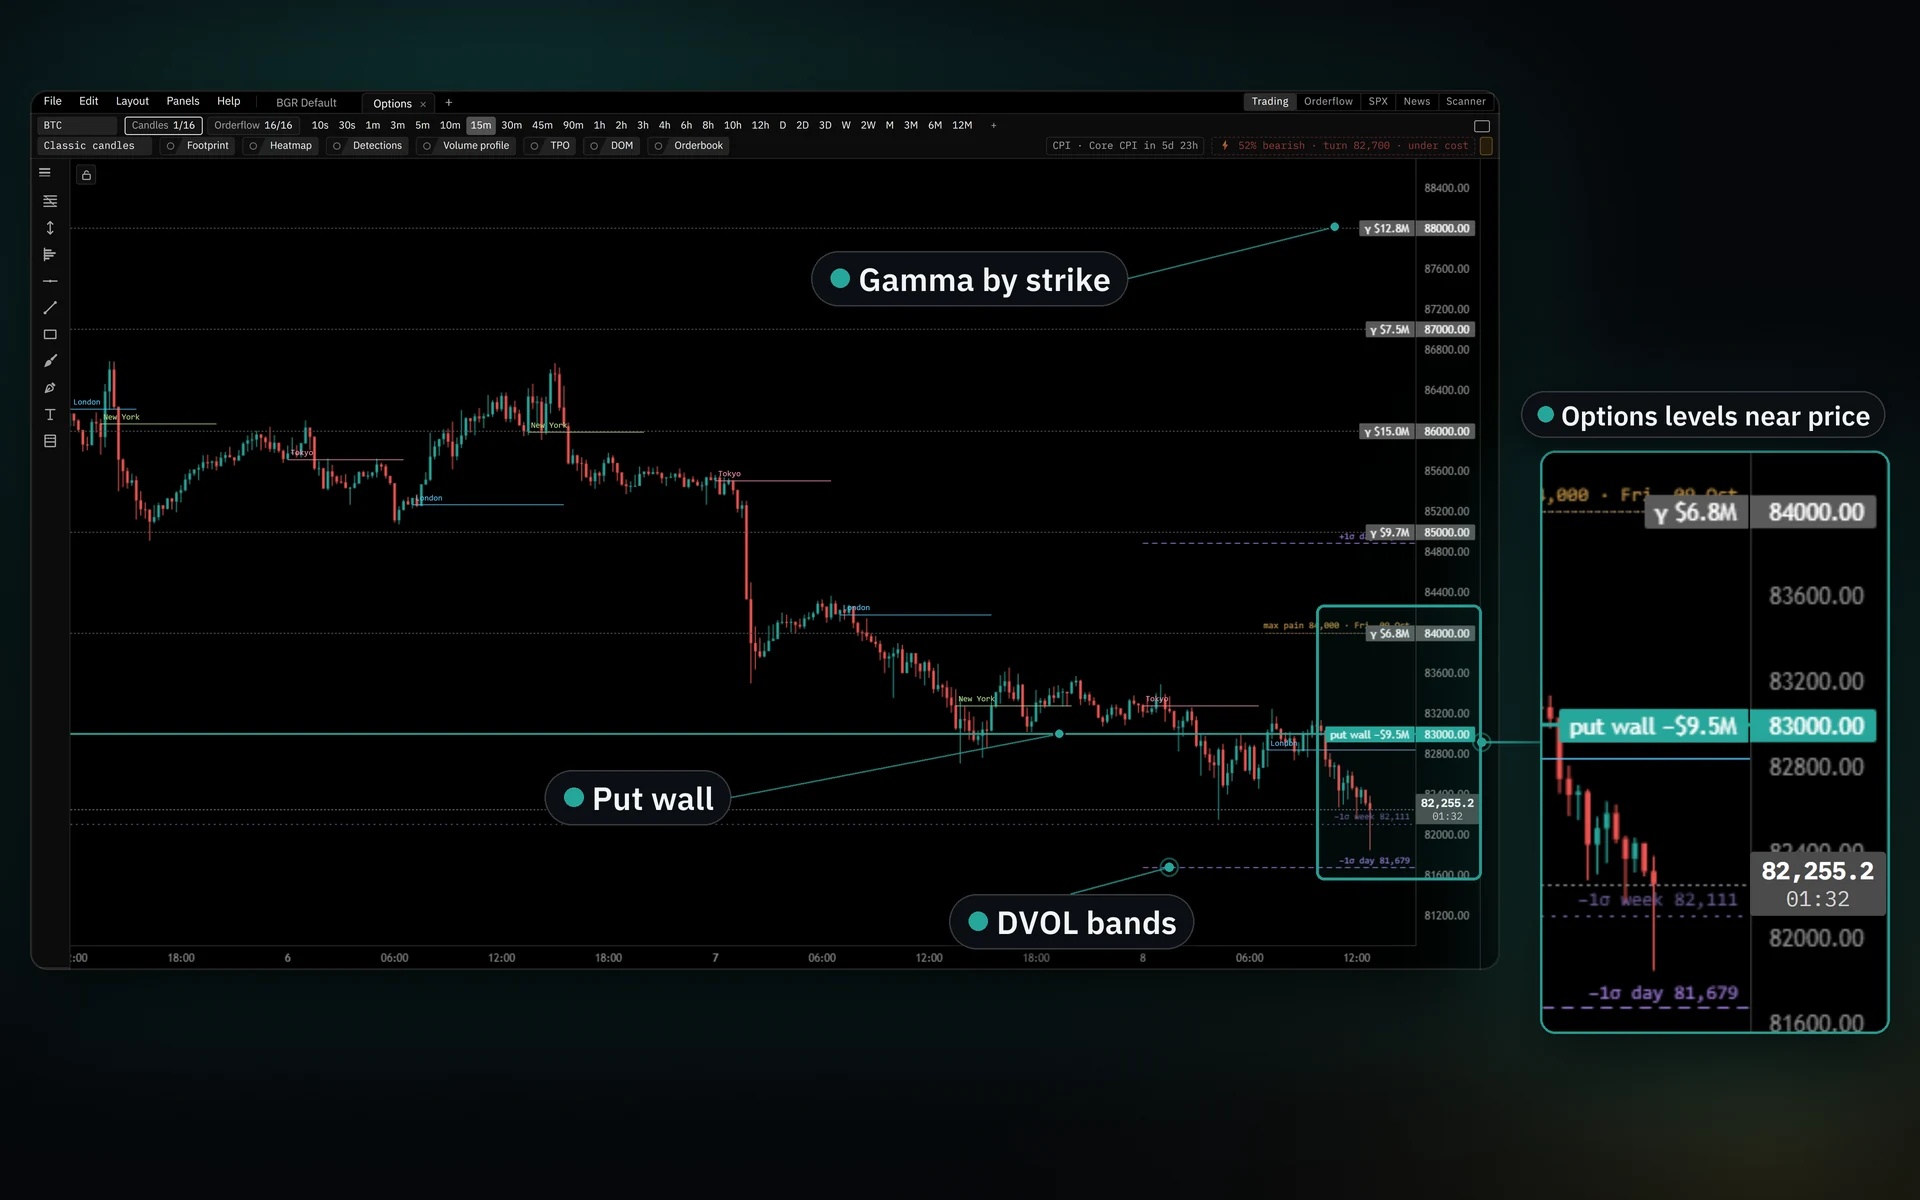
  • More in the desktop TerminalThe Terminal adds the footprint, live heatmaps, one aggregate of 15+ venues, dealer gamma and the trading panel.
  • An AI assistant with historyIt compares current price action with nearly seven years of one-minute bars.
  • No trade signalsNothing on this site tells you to buy or sell.
BTC
Open interest
Funding 8h
OI-weighted
Control 1h
BGR sentiment
0 to 100, live
Streams live
from the recorder

On the site

Desktop app

Blockchain Gravity Terminal

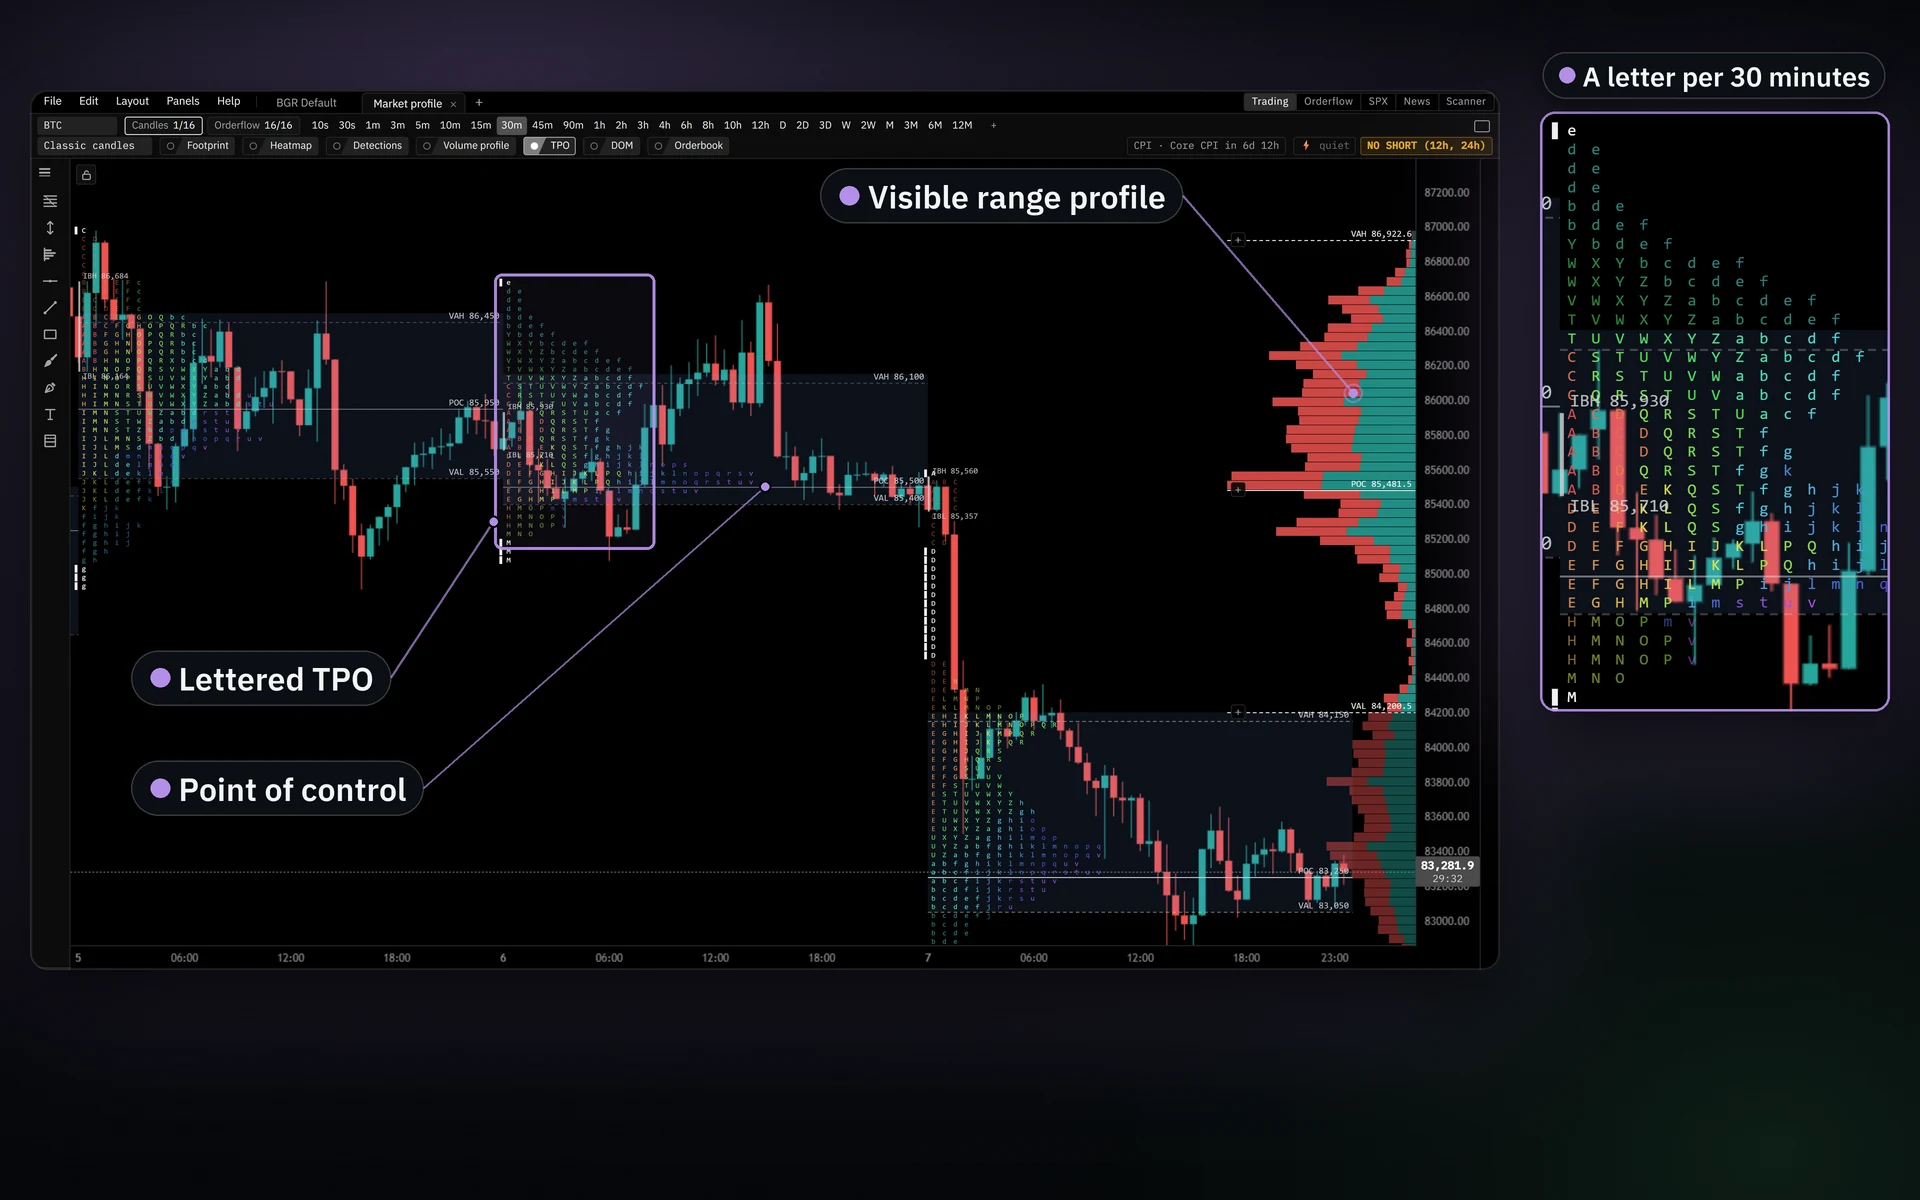
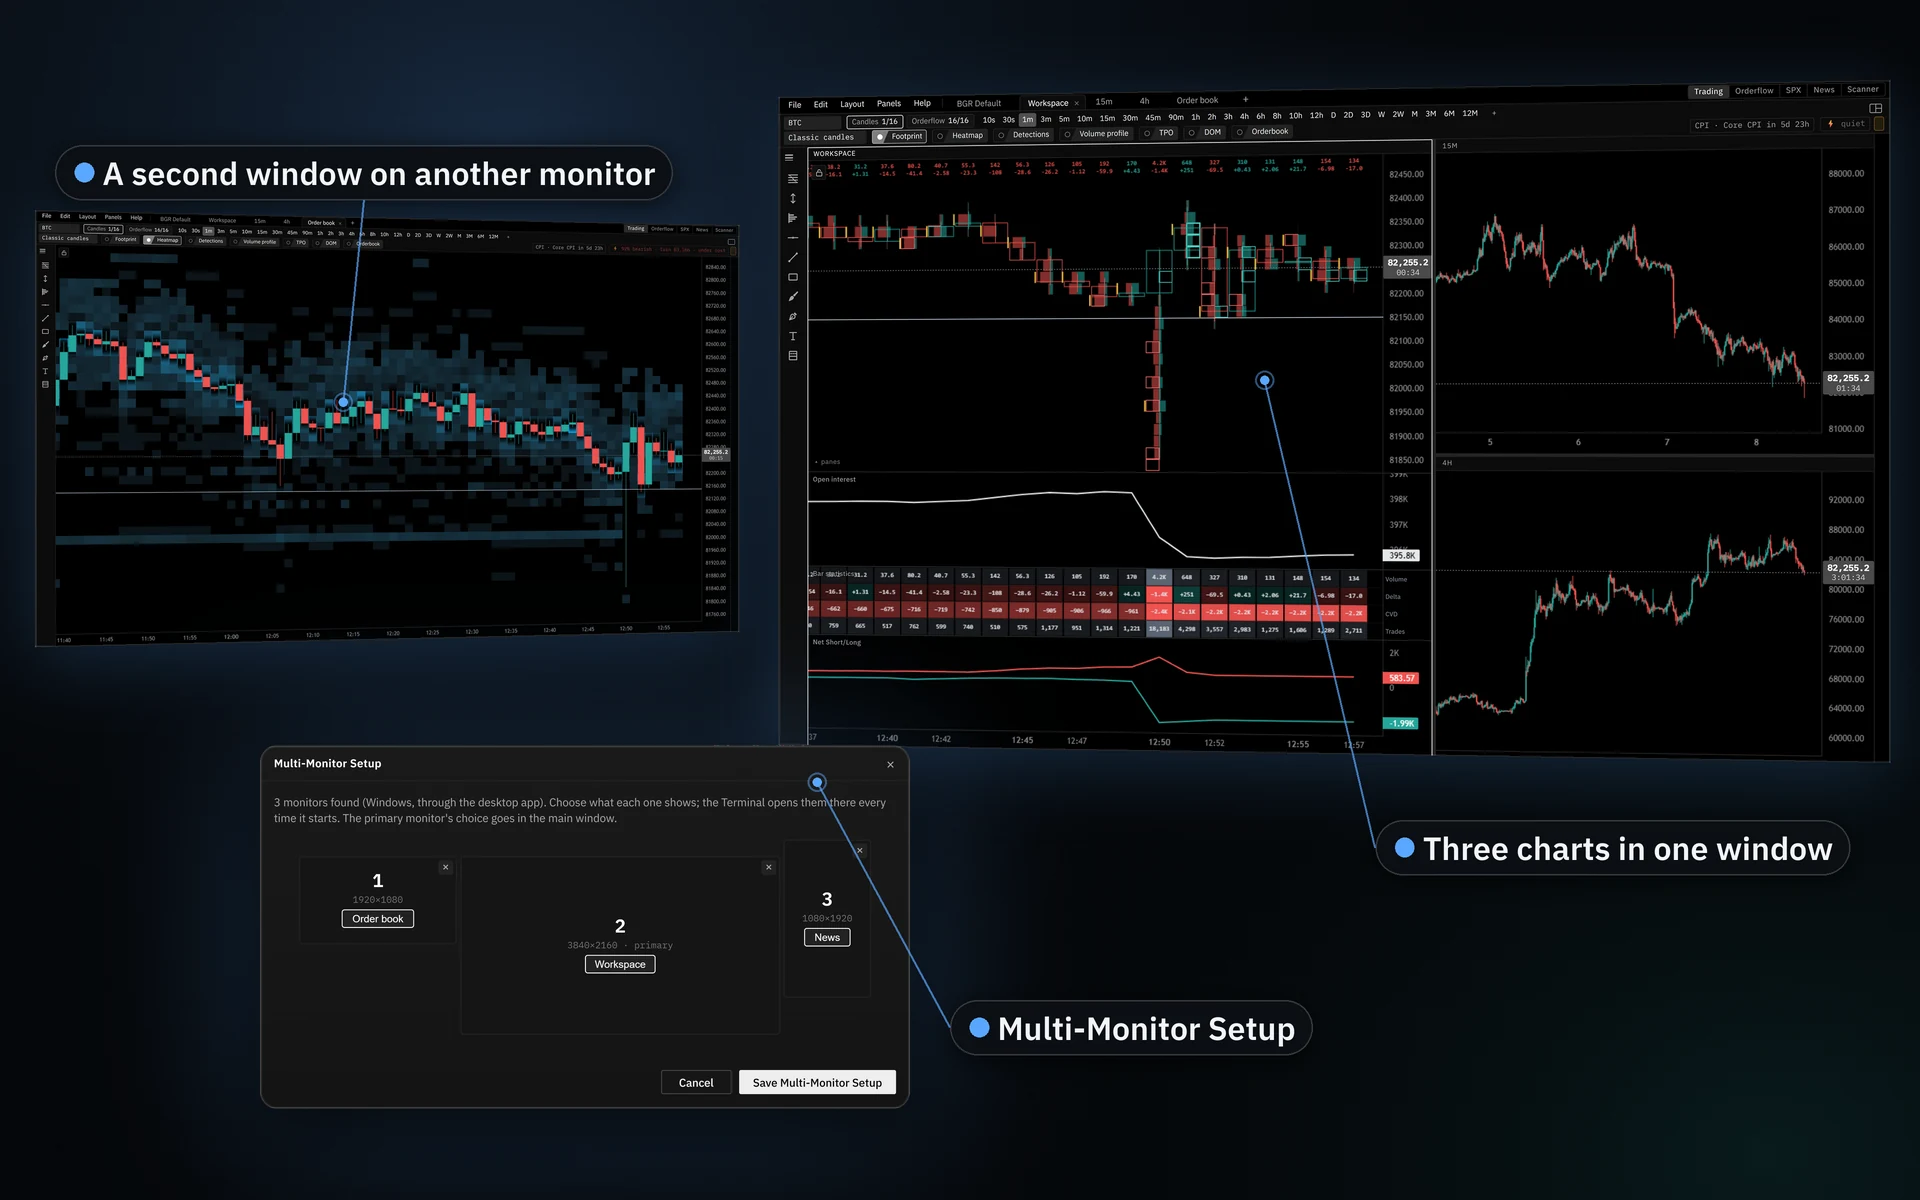
The Terminal is a Windows app built around the Bitcoin chart. It uses the same data as this website and shows more detail than a browser can. You get the footprint inside every candle, live order book and liquidation maps at one-minute resolution, every indicator summed across 15+ venues, dealer gamma and the AI assistant. The Custom API tier is coming soon and will add the trading panel and the research tools the founder uses for his own trading.

Your app gets live data straight from each exchange over your own connection. We record the history and serve it according to your plan. You activate a plan in the app with an email code, and you can cancel it from your account page in one click.

Get started

You can also try the Terminal for free, with every tool and all data delayed 24 hours. It needs no account.
Inside the Terminal

How every figure is calculated
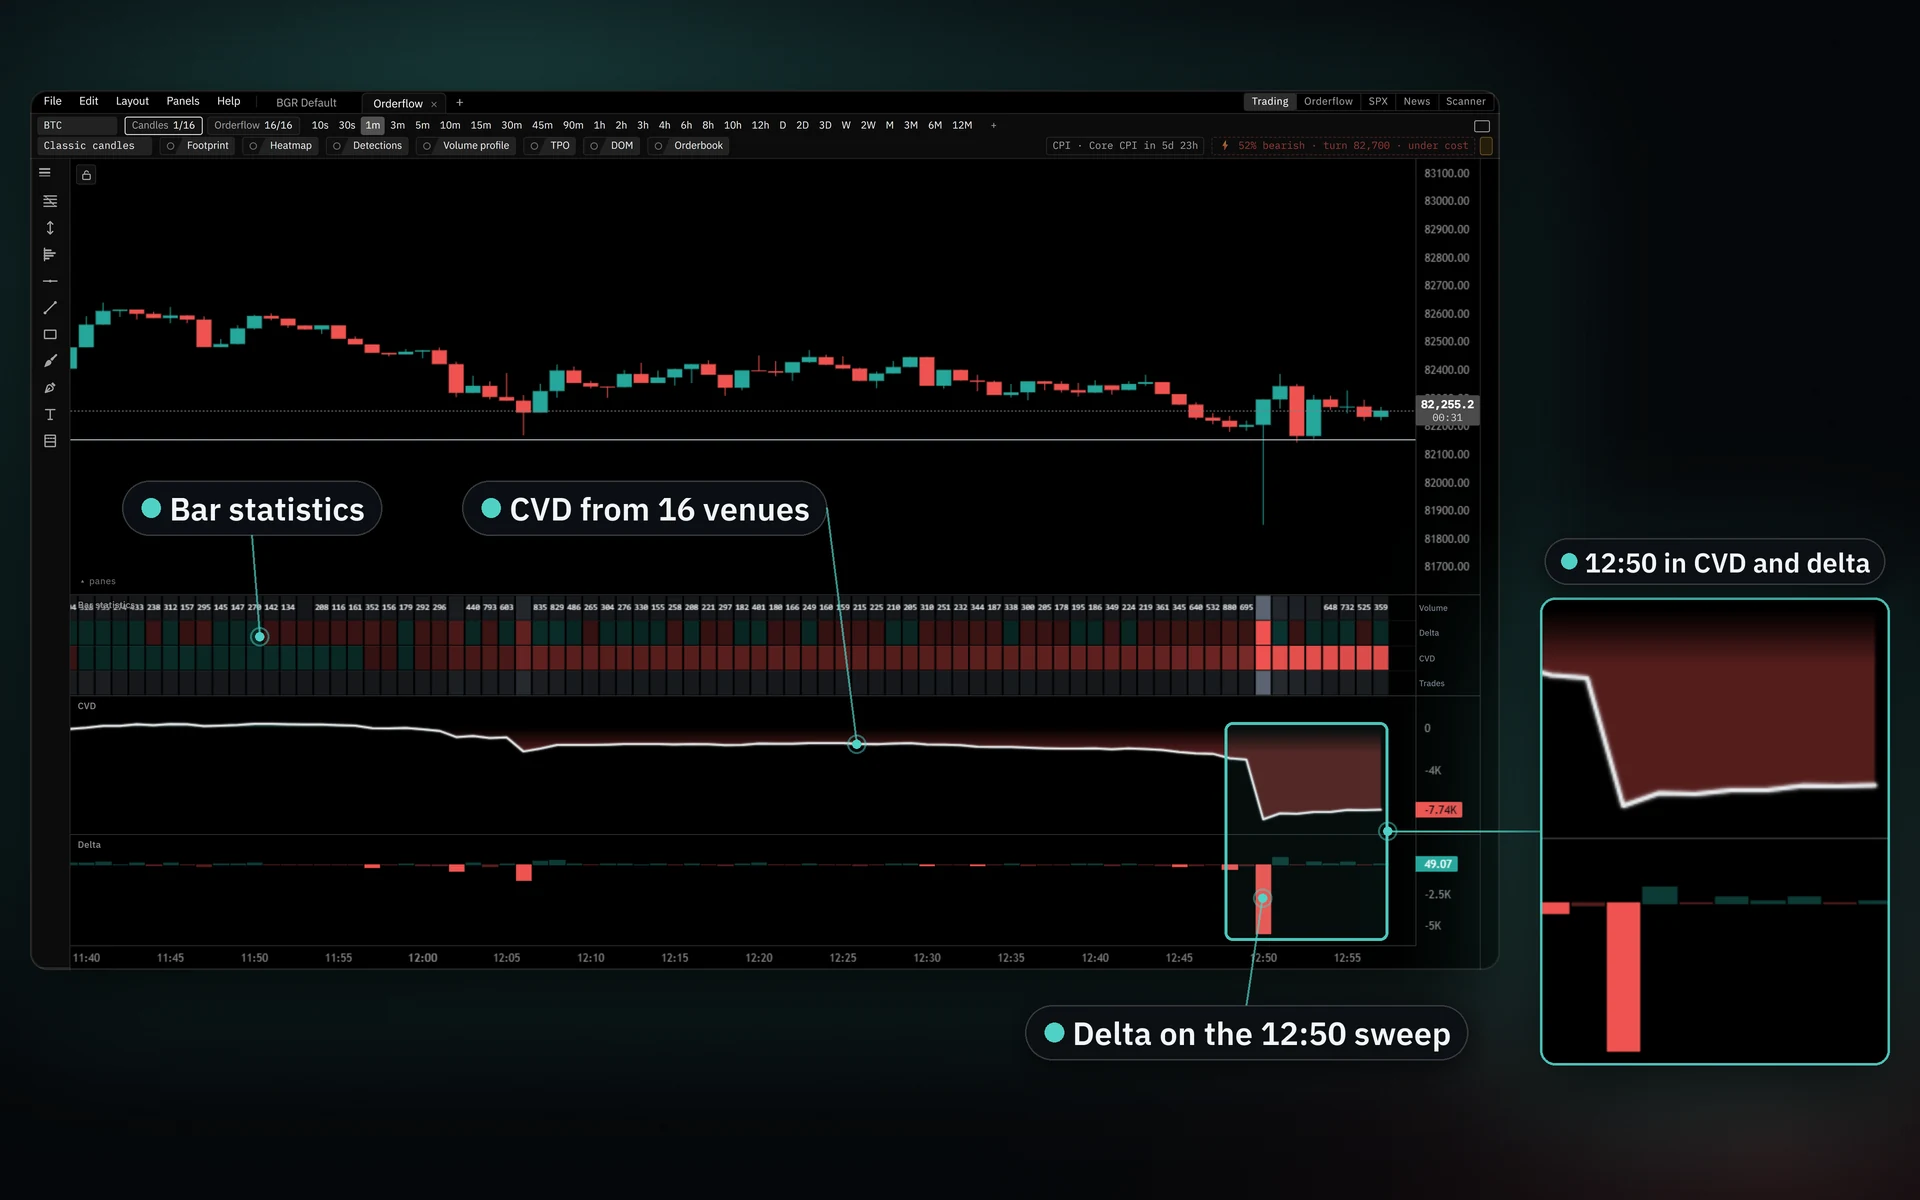
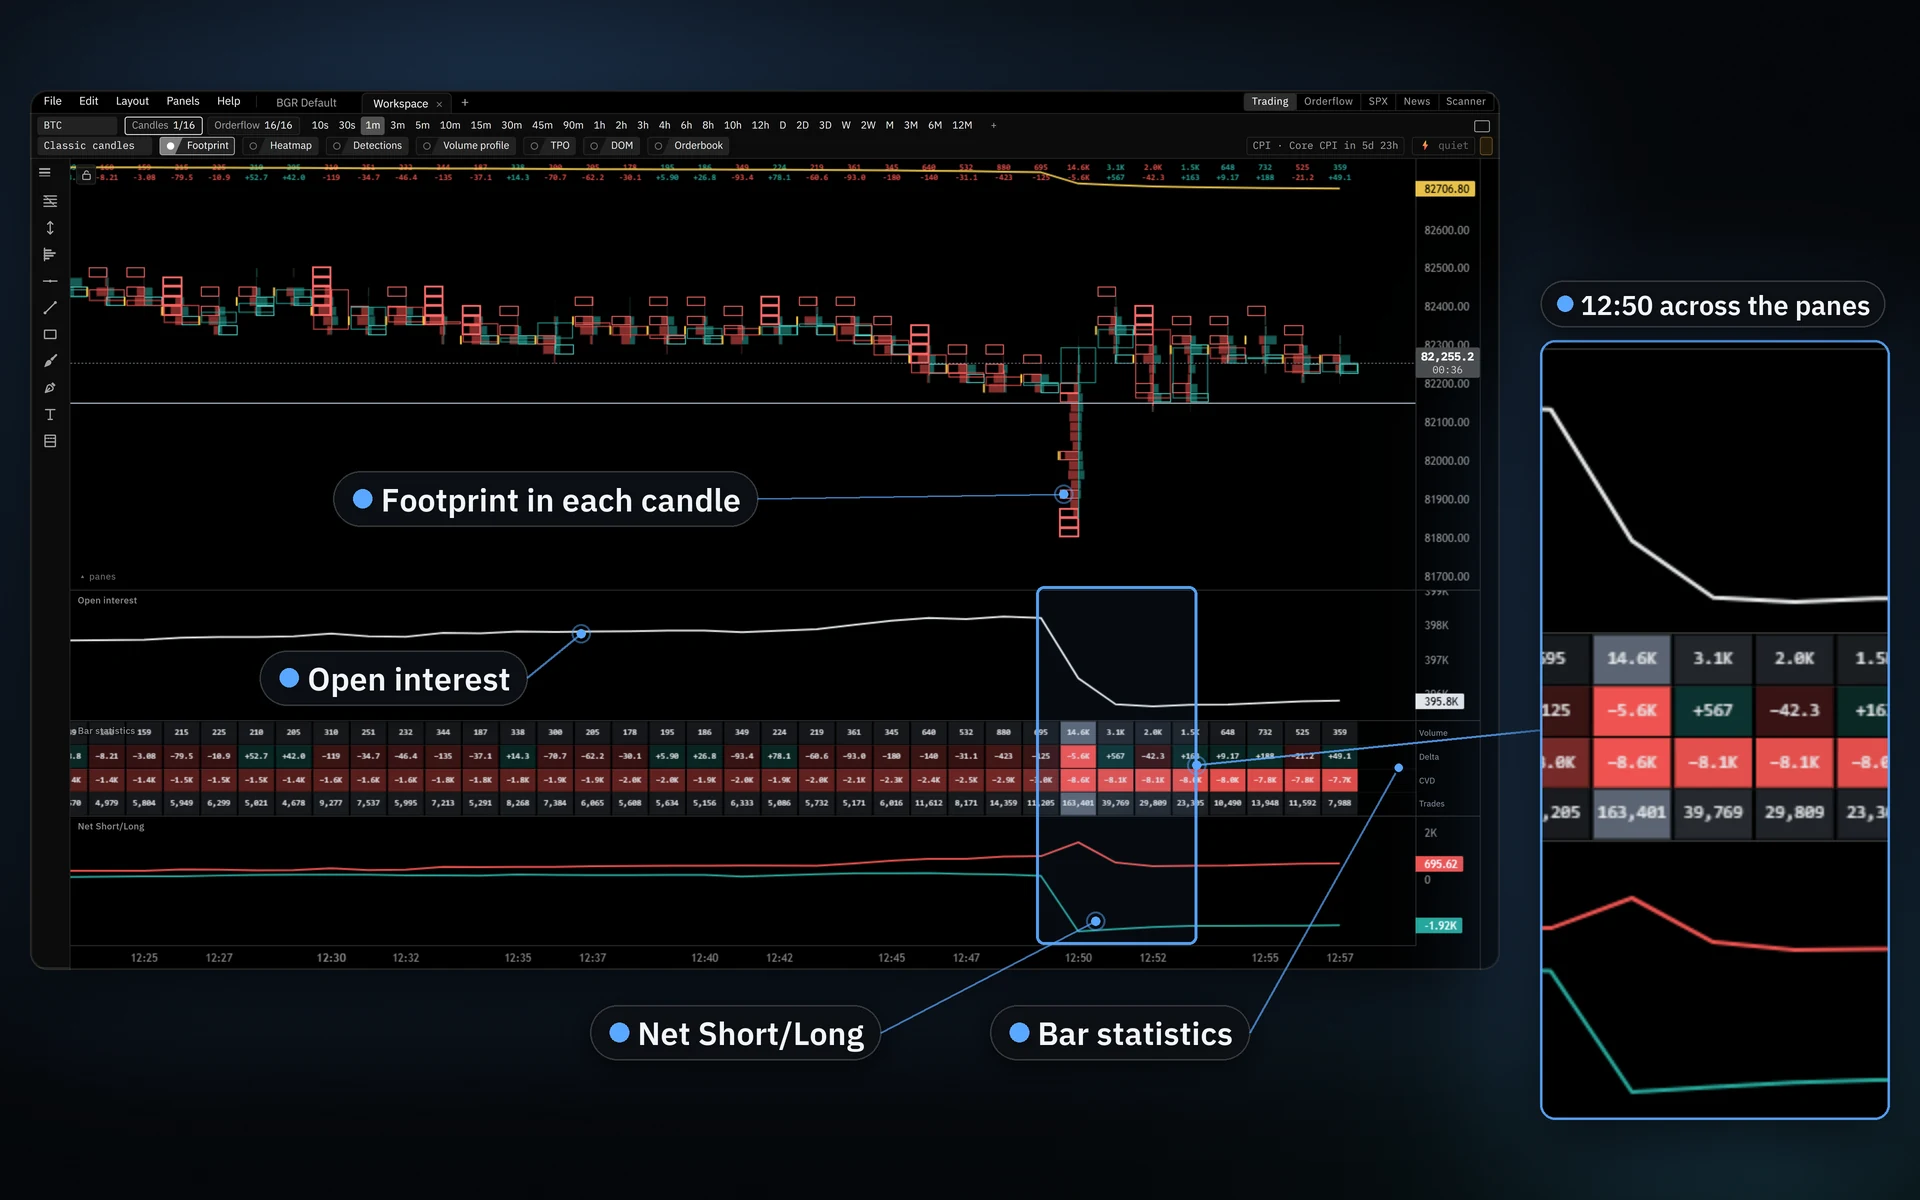
The Terminal's chart with the footprint on the price chart and panes for open interest, bar statistics and Net Short/Long, with the 12:50 sweep magnified across the panes
Chart and panes Terminal

The market around one chart

The footprint draws on the price chart, and panes for open interest, bar statistics and Net Short/Long share its time axis underneath. When price swept the 82,150 low at 12:50, it showed in all four at once.

  • Panes that share the chart's time axis
  • Panels you can dock on any side of the chart
  • Layouts that keep your panes, panels and timeframe
See plans

Join the community

Traders who use the Terminal discuss levels on our Discord, and we announce new releases there first. Anyone can join for free.

Join the Discord →
Support Three ways to get help
Email
support@blockchaingravity.com
Email us about billing and your account.
Ticket
Open a ticket on Discord
A ticket gets the fastest answer for a chart problem or a number that looks wrong. Please include a screenshot if you can.
FAQ
Read the FAQ
The FAQ covers signing in, payments, cancelling, API keys and how the Terminal works.